Nessus is excellent at scanning. What it produces when it is finished is not a report. It is a list of findings, organized by plugin and severity, with remediation guidance attached. That output is useful for practitioners who know how to read it. It is not a deliverable you hand to a client or present to a security committee.
Turning a Nessus scan into a professional vulnerability assessment report requires several steps that Nessus does not handle: filtering out noise, validating findings, making severity decisions, adding analyst context, and formatting the results into a structured document with an executive summary. Most teams do this work in spreadsheets and Word, which technically works and practically takes longer than it should.
This post walks through a complete workflow from .nessus file to finished PDF using JuturnaReport, a desktop application built specifically for this process.
Step 1: Import the scan
After running your Nessus scan and exporting the .nessus file, import it into JuturnaReport from the engagement screen. The import dialog parses the file and gives you an immediate summary before committing: total finding count, severity breakdown, and the hosts discovered in the scan.
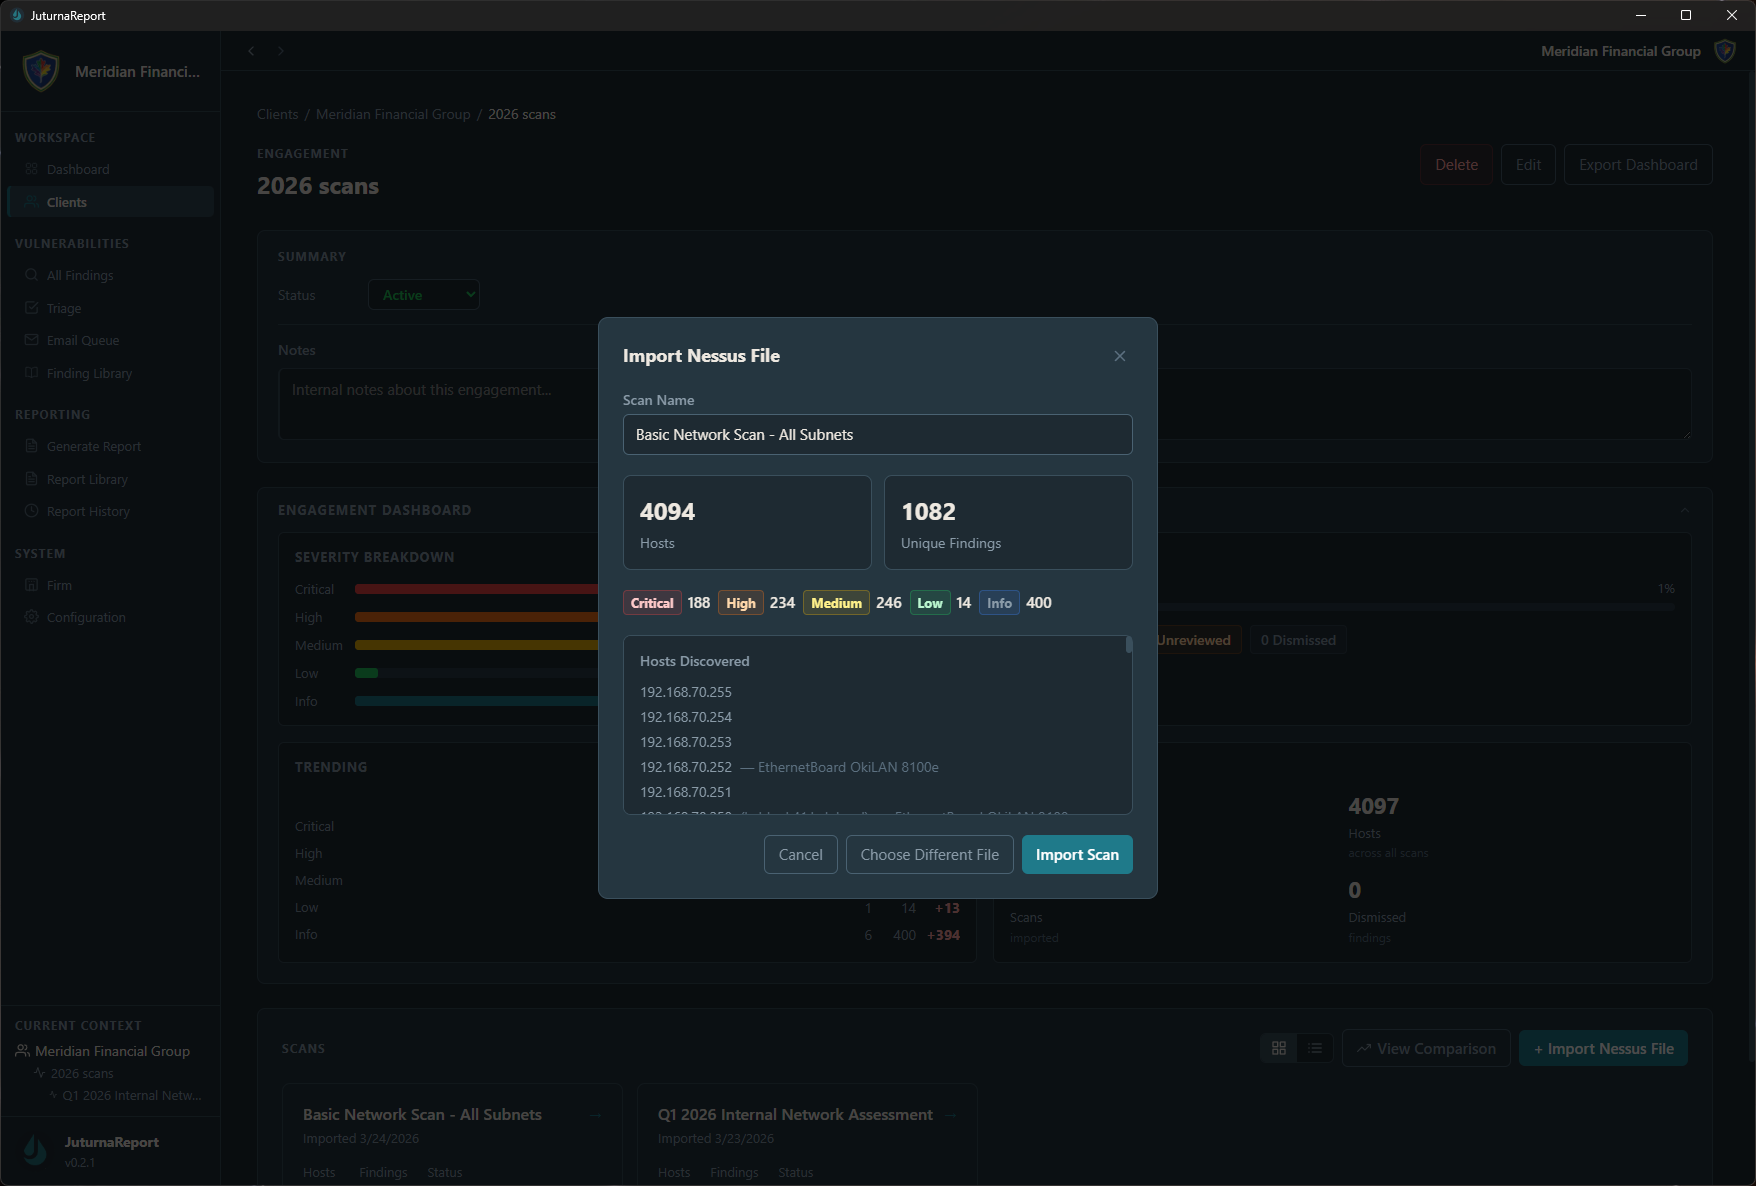
That breakdown at import is the first useful filter. A scan returning 4,000 findings sounds alarming until you see that the critical and high count is a fraction of that, and a significant portion is informational. You know before you start triage what you are actually working with.
Step 2: Triage the findings
The triage screen is where the real work happens. Every finding from the scan appears here, sortable and filterable by severity, status, plugin ID, affected host, and assignee. Each finding gets a status: send to client, false positive, investigating, snoozed, or resolved.
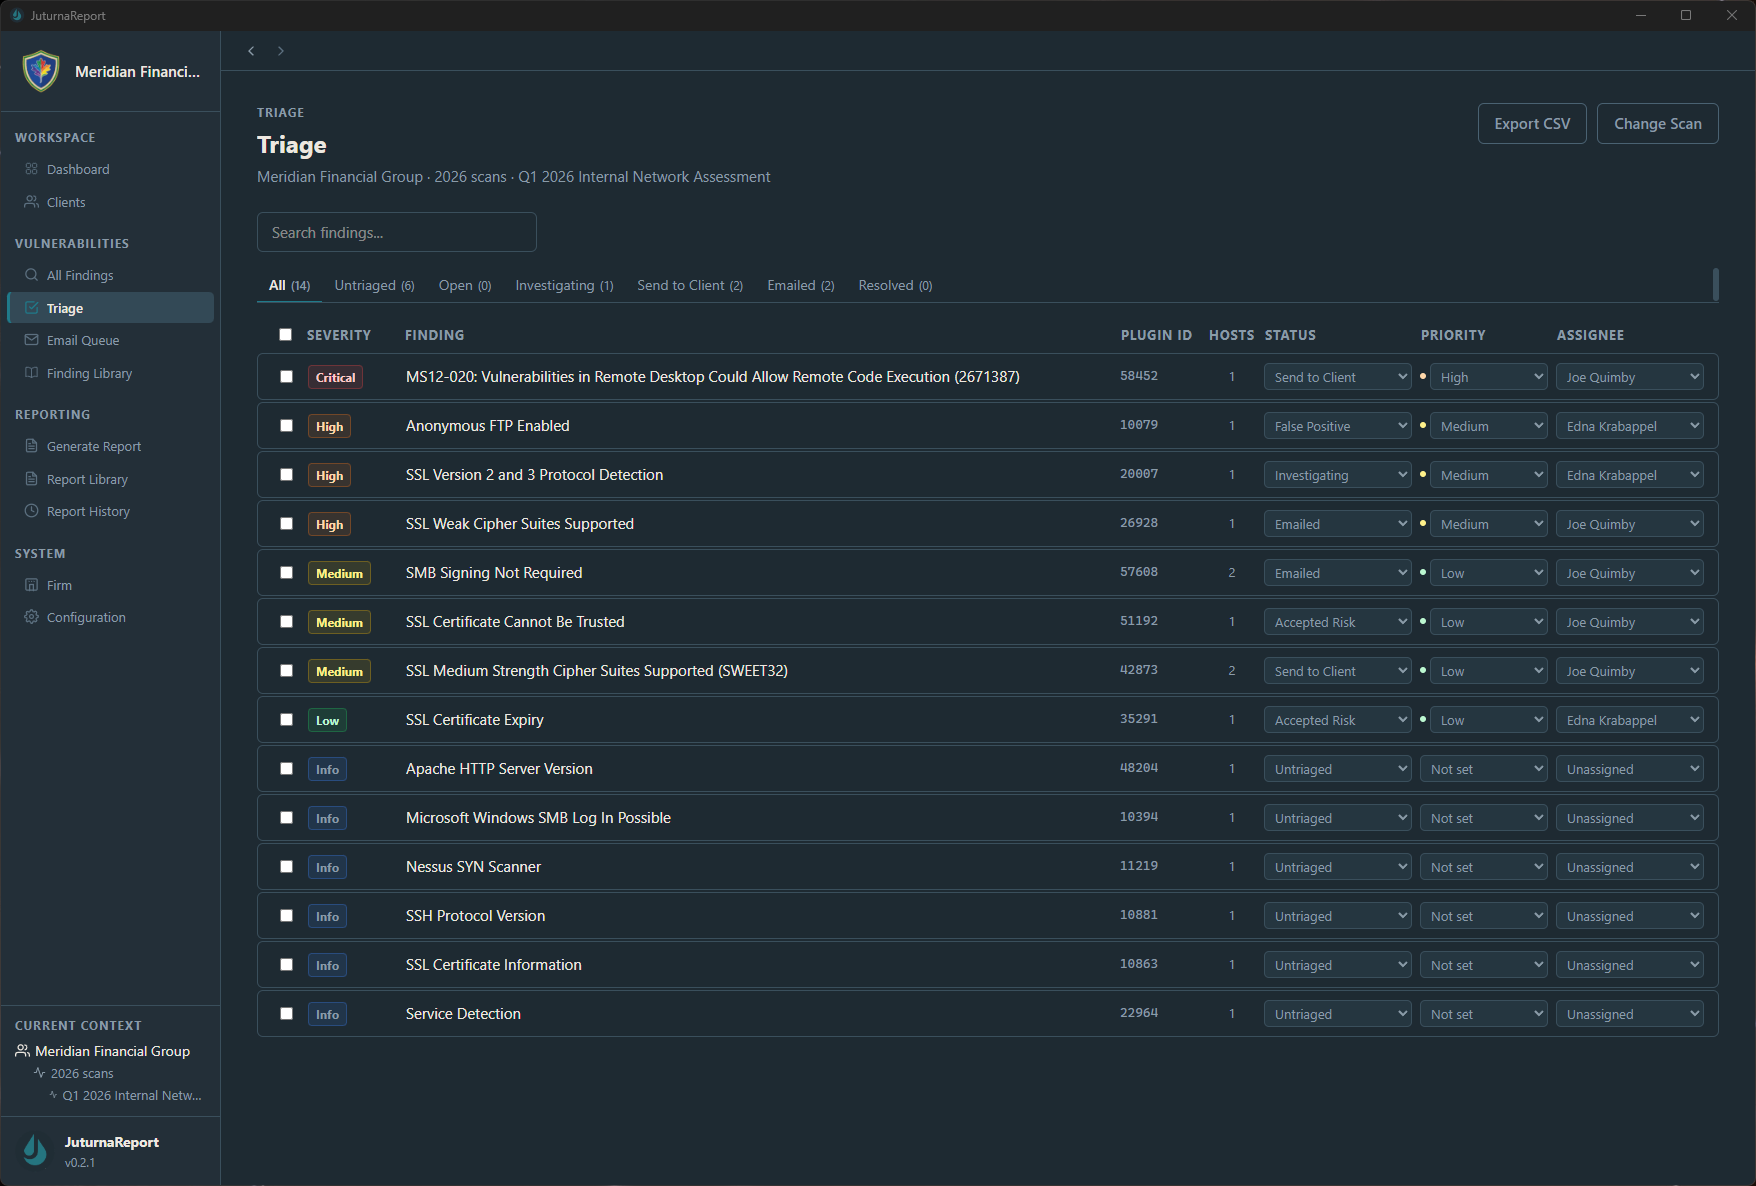
The goal of this pass is to separate findings that belong in the report from findings that do not. Informational items that carry no real risk get dismissed. Known false positives get flagged as such. Duplicate findings that map to the same underlying issue get reviewed together. By the time triage is complete, the findings in the “send to client” column represent what you actually believe warrants remediation.
For each finding you keep, the detail view gives you space to adjust severity, add analyst notes, and record triage decisions with a timestamp. That audit trail matters. When a client asks six months later why a particular finding was dismissed, the triage history is the answer.
The finding library accelerates this step on repeat engagements. If your library already contains a well-written description and remediation guidance for a common finding type, you pull it in rather than writing from scratch. SQL injection looks like SQL injection across most environments.
Step 3: Configure and generate the report
With triage complete, move to the Generate Report screen. Select the scan and engagement, choose a report template, and configure the output.
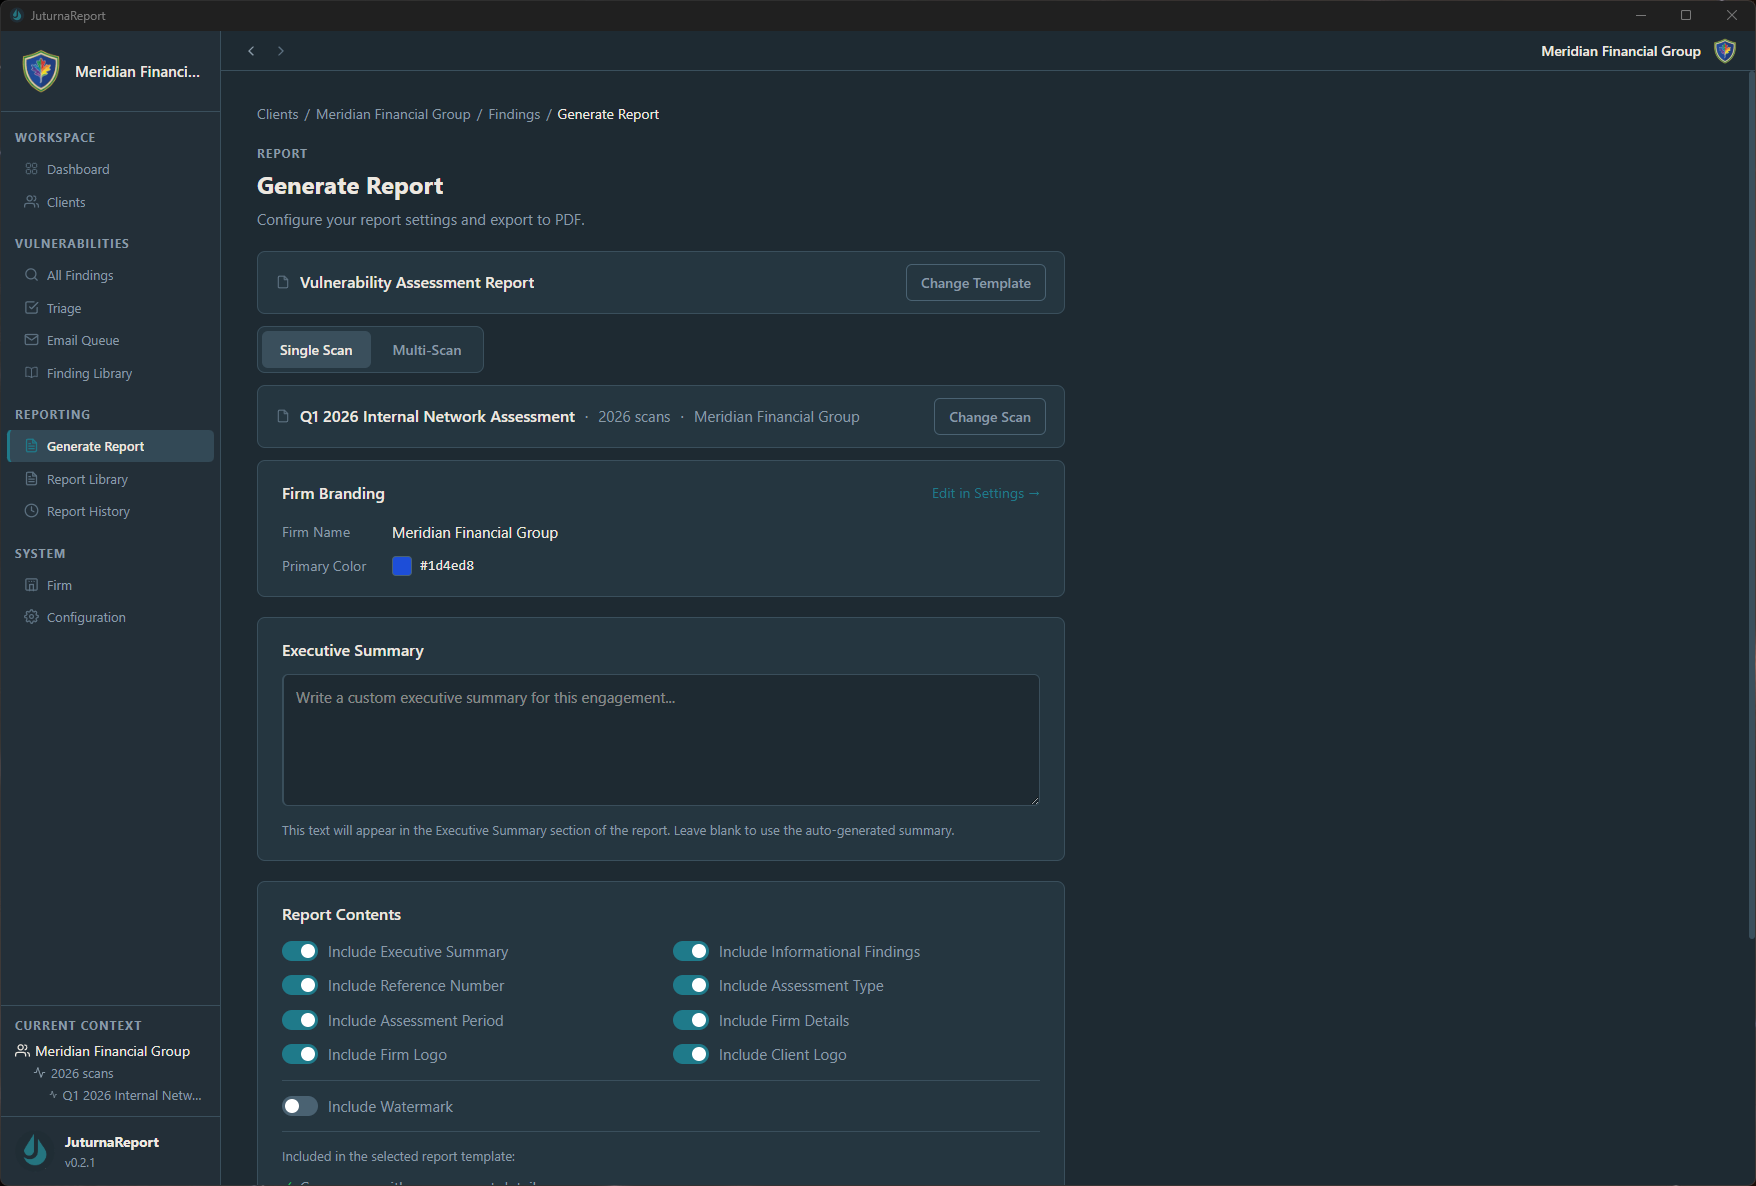
The configuration options here cover the elements that vary by engagement. Firm branding sets your name and primary color across the report header and cover page. The executive summary field is where you write the plain-language assessment of the client’s overall security posture; the generated report will include what you write here rather than auto-generating it, because an executive summary written by an analyst is more useful than one assembled from finding counts. Report content toggles let you include or exclude sections depending on what the engagement requires: informational findings, improvement period tracking, reference numbers, and client logo.
Multi-scan reports, which combine findings across multiple .nessus imports into a single deliverable, are available from the same screen when an engagement has more than one scan.
The output
The report exports as a PDF. The structure follows the template: cover page with client and engagement details, executive summary, findings summary table sorted by severity, and detailed findings with description, affected systems, and remediation guidance for each.
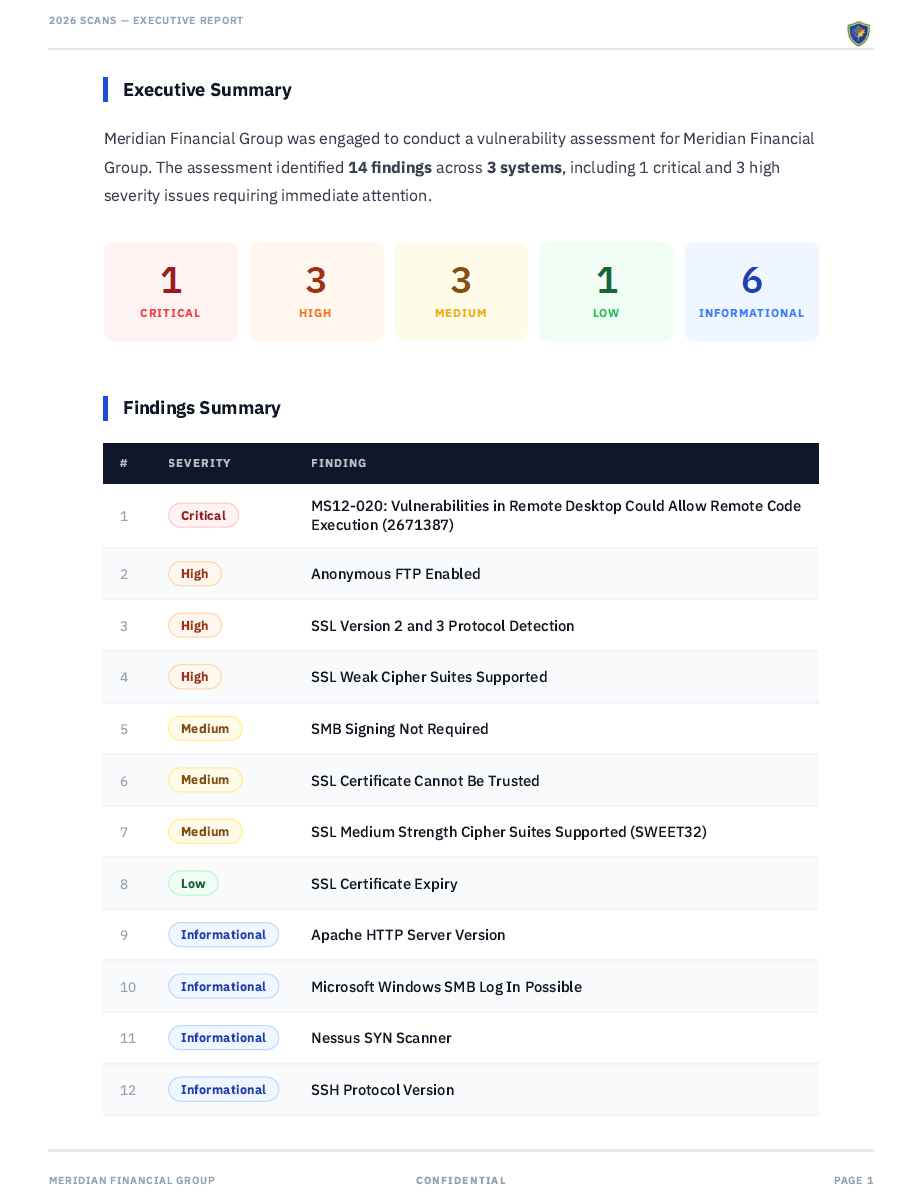
The executive summary pulls directly from what you wrote during report configuration. The findings table reflects the triage decisions you made: only the findings you marked for the client appear, with the severity ratings you assigned. If you adjusted a severity during triage, the adjusted rating is what shows in the report.
The PDF is ready to send. No post-processing in Word, no manual formatting, no copy-paste from scanner output.
What this workflow replaces
The manual version of this process involves exporting Nessus output to CSV, opening it in Excel, sorting and color-coding by severity, copying finding descriptions into a Word template, adding analyst notes in-line, reformatting the document, and exporting to PDF. For a scan with a few hundred findings going into a ten-page report, that process can consume most of a day. For recurring assessments against the same client environment, it consumes that day every single time.
JuturnaReport runs locally on Windows with an encrypted local database and no cloud dependency. It works in air-gapped environments. Early access pricing is $49/year or $149 lifetime, with one license covering up to three machines. Full details at /pricing/.